Timeline
The Timeline page provides a visual representation of key events, documents, conditions, procedures, medications, and labs over the years. This guide will help you navigate and utilize the page effectively.
Top Navigation Options
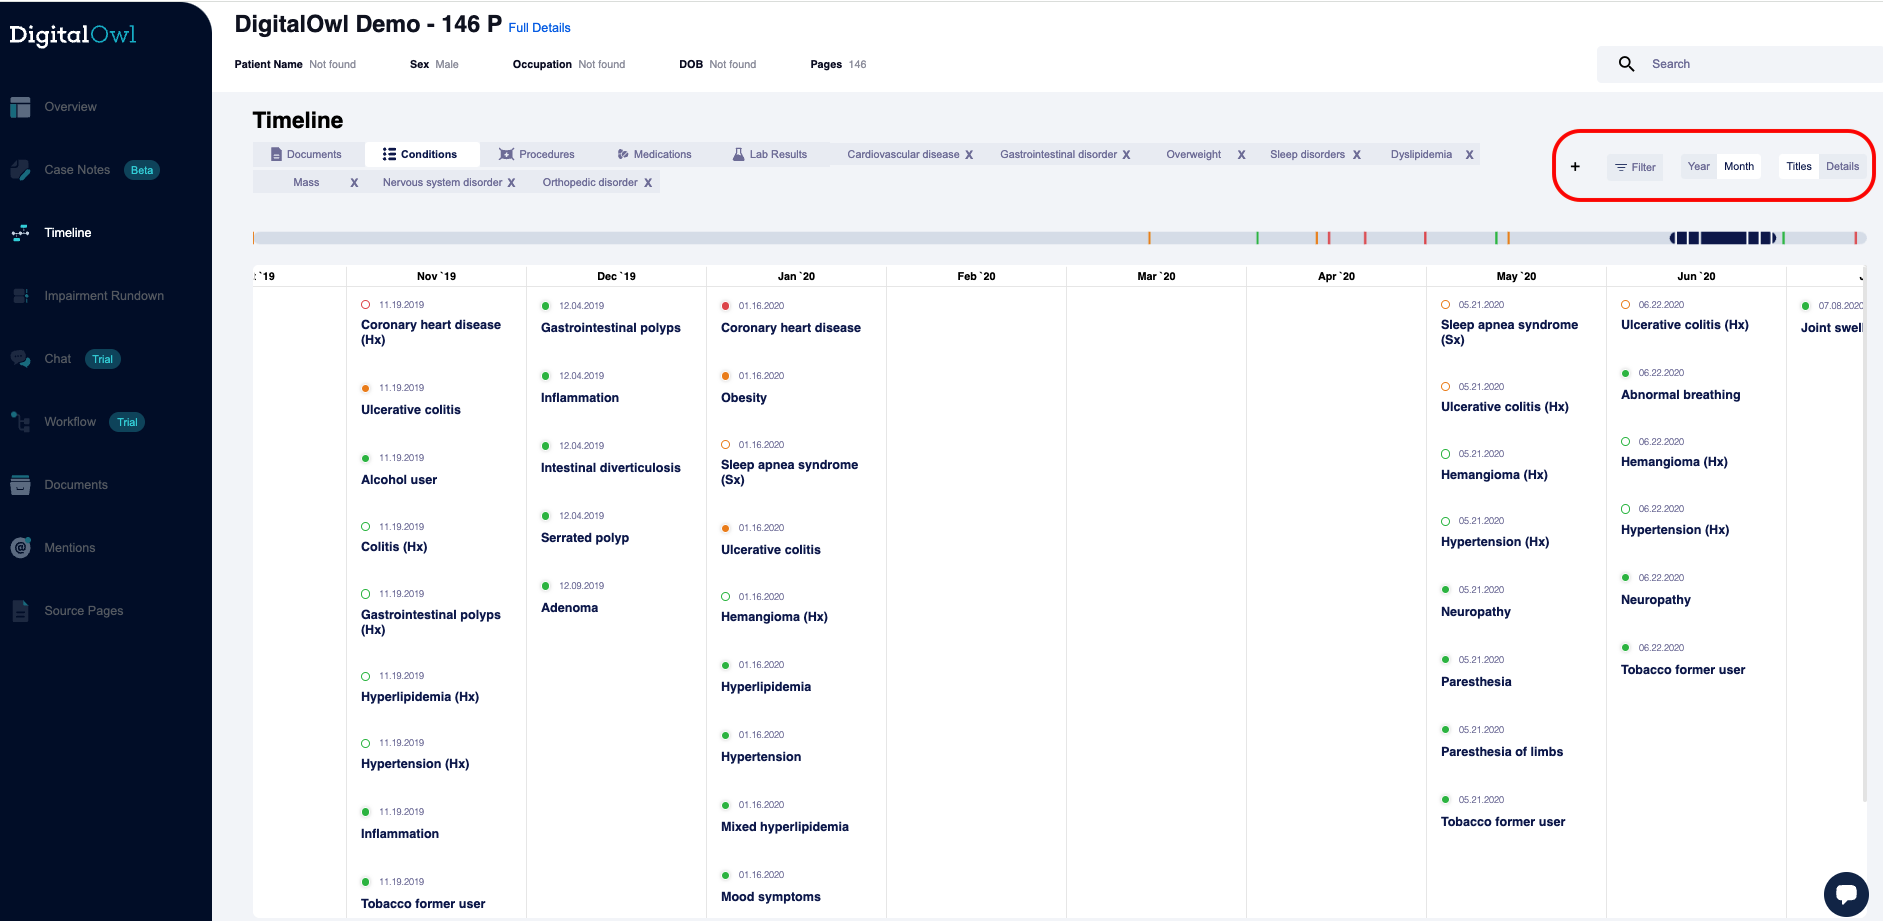
- Year and Month View:
Toggle between "Year" and "Month" views to adjust the timeline scale. The "Year" view shows a broader overview, while the "Month" view provides a more detailed look at specific periods. - Titles and Details:
- Use the "Titles" button to view specific events or items on the timeline.
- Click "Details" to show a small excerpt from the source text, providing more context about each event.
Timeline Components
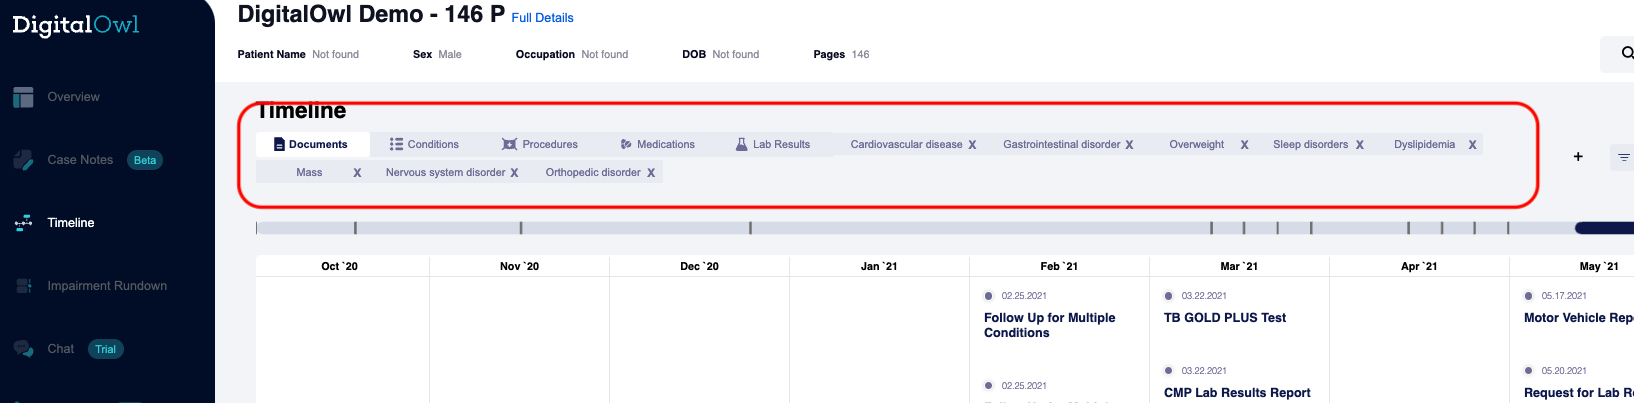
The tabs across the top of the screen include Documents, Conditions, Procedures, Medications, and Lab Results. Clicking on the tab populates the timeline with all references for that specific data set.
Additionally the AI will populate the major impairment categories within the specific case. Clicking on an impairment will populate the timeline with just those related mentions.
The filled circles are the current mention, the ones with an empty circle are historical mentions.
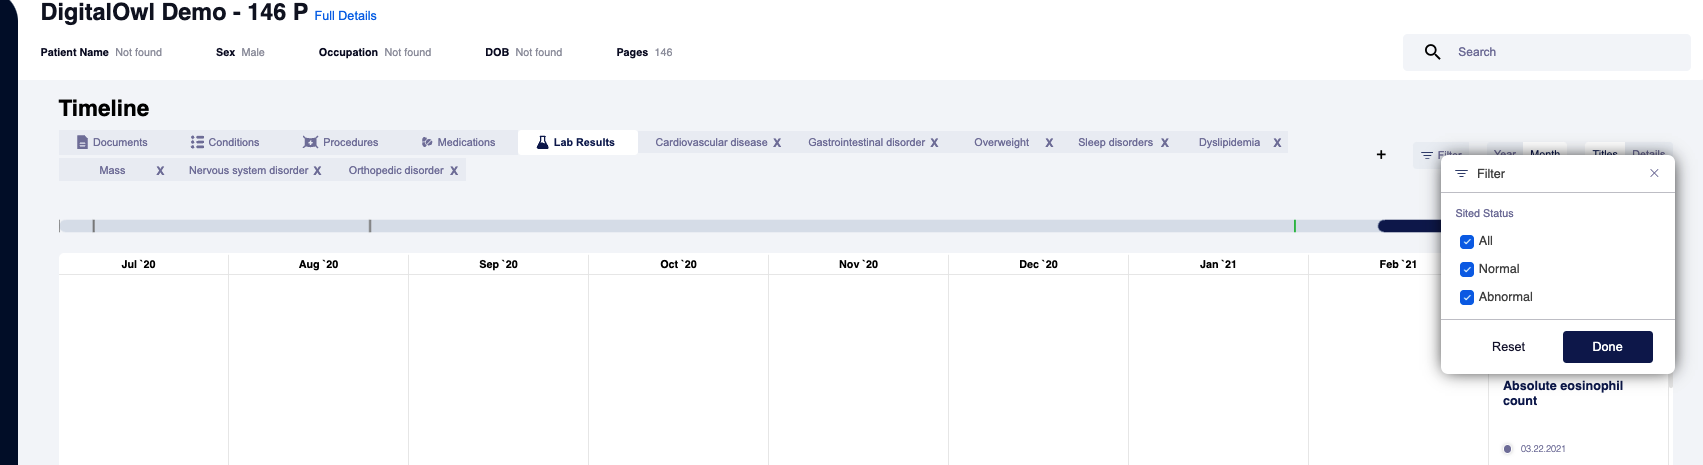
There is also the ability to filter each tab within the view. Conditions and Procedures allow for Severity filtering while the Lab Results tab allows for all, normal or abnormal only. Clicking the "abnormal" would filter out all the normal labs and create a view that only has "abnormal" labs within the Lab Results part of the Timeline.
NOTE
Any changes made to the timeline (e.g., filters, adding/removing rows) will not be permanent. Refreshing the page or going into a new case will bring up the default view without any of the changes you may have performed in your review.
Additional Features
Scroll Bar(Dark Blue): Use the scroll bar at the top to move through the timeline and explore different periods.
Updated about 1 month ago